logo

Please Wait...

  • home-2-slider
    MATHEMATICS AND THE WORLD AROUND US
    REAL-LIFE, REAL-WORLD, CONTEX-BASED, APPLIED MATHEMATICS

No other person's ideas, and none of my own ideas, are as authoritative as my experience.


Carl Rogers
Mathematics doesn't have to be an "apparition"

Mathematics in Medicine

Have you ever heard about the "importance of mathematics in medicine"? Do you believe it? How can we use our mathematical knowledge in this field?

Just follow the text and you will find the answer!

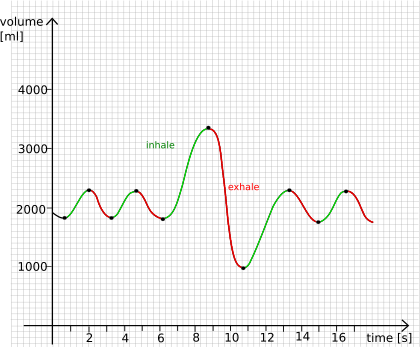
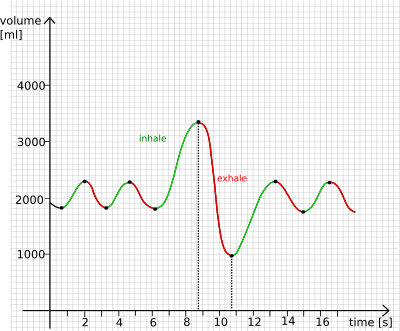
We will look together for a mathematics in a result of medical assessment named SPIROMETRY.
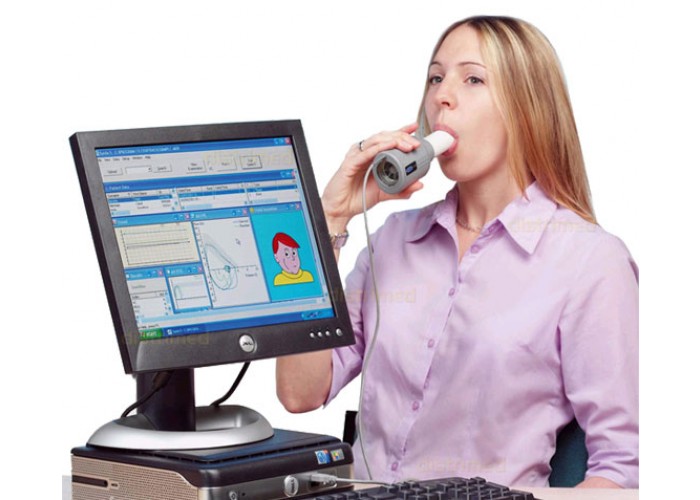
Help of a computer

Spirometry Result

To help a doctor make a diagnosis, the modern spirometry result does not contain only siprometry curve, but also

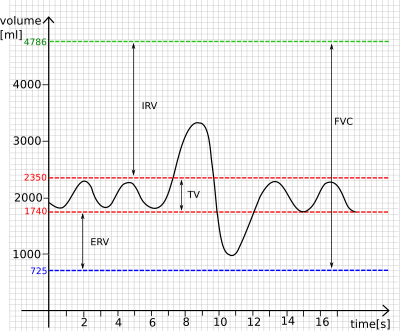
o Key measured values
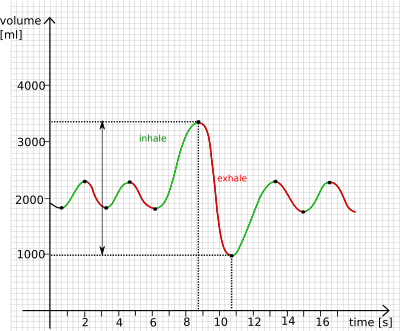
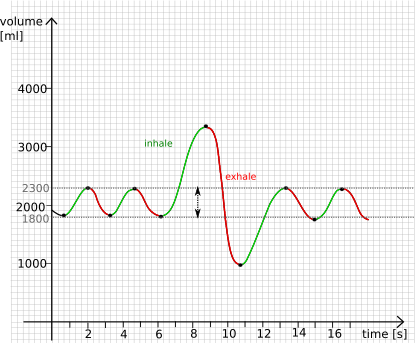
o Volume-Time curve

o Flow-Volume loop

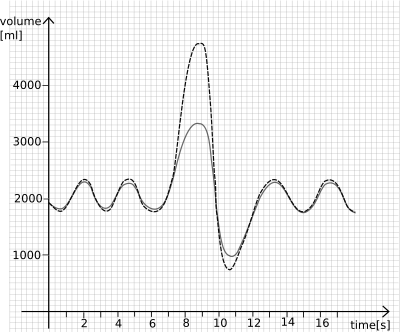
o Comparable values (values, which should be achieved by a healthy man/woman)

Our task for the next pages is to find out how the computer creates this result. And also find out what the numbers and curves can tell the doctor about the patients' healthy conditions.

Mathematics hidden inside

What can I expect from Mathematics?

o Functions and its characteristics

o Graphs and formulas

o Derivatives

o Reading with understanding

o Deduction

And much more...

Is it difficult?

Do I Need To Know 'a lot of' Mathematics?

The answer is NO. Do not worry! The only thing what you need is a little bit of time and to have a fancy for thinking ;).

Answers

PLEASE NOTE that the answers taken from the graph's data are only approximate! The difference between yours and our answers can be +-100ml.

Answer 1.1

Our patient's Forced Vital Capacity is approximately 2340ml.

If there is a big difference between yours and our answer, try to check the HELPER to this problem (bulb picture).

Answer 1-1 graph
Answer 1.2

Yes, there is a difference.

Forced Vital Capacity of a healthy, 56 years old man who is 171cm tall should be 4.06l, but the patient's measured FVC is 2.34l.

Our patient's Forced Vital capacity is decreased.

Answer 1.3

There can be Restrictive lung disease expected but, to affirm this suspicion, it is necessary to know other parameters' values like Forced expiratory volume in 1 second (FEV1) or Peak expiratory flow (PEF).

(Missing parameters are discussed and can be discovered and understood in the next chapters.)

Answer 1.4

Our patient's Tidal Volume is approximately 0.5 liter.

Answer 1-1 graph

Expiratory Reserve Volume is approximately 0.82 liter.

Inspiratory Reserve Volume is approximately 1.02 liter.

Note:There was a small change in an exhaled air at the end of the Spirometry - patient exhaled deeper. Mentioned change is caused by a forced exhalation in 9 - 11 second and we can neglect it in our counts.

Answer 1.5

Tidal volume of a healthy, 56 years old man, non-smoker who is 171 cm tall is lying in an interval <0.61 l ; 0.73 l> (15% - 18% of FVC of a healthy man, non-smoker, who has requested high and age).

Expiratory Reserve Volume of a healthy, 56 years old man, non-smoker who is 171 cm tall is 1.02 liter.

Inspiratory Reserve Volume of a healthy, 56 years old man, non-smoker who is 171 cm tall is 2.44 liter.

Our patient's measured values in comparison to the values of a healthy man, 56 years old, non-smoker, who is 171 cm tall.

56 YEARS OLD MAN, 171 cm FVC [l] TV [l] ERV [l] IRV [l]
MEASURED/PATIENT'S VALUES 2.34 0.5 0.82 1.02
IDEAL/TABLE VALUES 4.06 <0.6, 0.73> 1.02 2.44
Answer 1.6
Answer 1-6 graph
Answer 1-6 graph

something to think about: Is the y-location (location against the volume ax-axis) of a spirometry curve important? Is there any change on TV, IRV, ERV and FVC if we move it above/below?

Helpers

PLEASE NOTE that the answers taken from the graph's data are only approximate! The difference between yours and our answers can be +-100ml.

Helper 1.1

Firstly, it is necessary to understand the graph we are working with.

Try to answer following questions

1. Which Spirometry Curve parts are related to the patient's inhalations and which one to his exhalations?

To find an answer to this question, the imagine of a simple breathing can help. Try to close your eyes, inhale and exhale few times. Is the air volume in your lungs increasing or decreasing when you are inhaling air?

Check your answer HERE

Helper 1-1 graph
2. When the patient's greatest exhalation started? (the exhalation during which patient exhaled the greatest volume of an air)

Note

If there are more than one of this type of exhalations, we are interested in the first one. The first one was executed on behalf of a doctor's appeal, after a forced inhalation.

Check your answer HERE

Helper 1-1 graph
3. When the patient's greatest exhalation finished?

Check your answer HERE

Helper 1-1 graph

I am sure, you can solve the problem 1.1 easily now. What is the volume of an air exhaled during the greatest exhalation?

Helper 1.2

Try to look to the Forced Vital Capacity predicted values' table (a link is available after problem 1.2 assignment).

What Forced Vital Capacity should have a healthy man, who is 56 years old and 171cm high?

As a height unit, INCH is used in a table. Inches are usually used in an anglophone districts, most common in the USA and the United Kingdom (1 inch = 2.54 cm).

Man's Forced Vital Capacity Predicted Values
AGE (years)
HEIGHT (inches) 51 53 55 57 59 61 63 65
60 2.97 2.91 2.85 2.79 2.74 2.68 2.62 2.56
60.5 3.05 2.99 2.93 2.88 2.82 2.76 2.70 2.64
61 3.13 3.08 3.02 2.96 2.90 2.84 2.79 2.73
61.5 3.22 3.16 3.10 3.04 2.98 2.93 2.87 2.81
62 3.30 3.24 3.18 3.12 3.07 3.01 2.95 2.89
62.5 3.38 3.32 3.26 3.21 3.15 3.09 3.03 2.97
63 3.46 3.41 3.35 3.29 3.23 3.17 3.12 3.06
63.5 3.55 3.49 3.43 3.37 3.31 3.26 3.20 3.14
64 3.63 3.57 3.51 3.45 3.40 3.34 3.28 3.22
64.5 3.71 3.65 3.59 3.54 3.48 3.42 3.36 3.30
65 3.79 3.74 3.68 3.62 3.56 3.50 3.45 3.39
65.5 3.88 3.82 3.76 3.70 3.64 3.59 3.53 3.47
66 3.96 3.90 3.84 3.78 3.73 3.67 3.61 3.55
66.5 4.04 3.98 3.93 3.87 3.81 3.75 3.69 3.64
67 4.12 4.07 4.01 3.95 3.89 3.83 3.78 3.72
67.5 4.21 4.15 4.09 4.03 3.97 3.92 3.86 3.80
68 4.29 4.23 4.17 4.11 4.06 4.00 3.94 3.88
68.5 4.37 4.31 4.26 4.20 4.14 4.08 4.02 3.97
69 4.45 4.40 4.34 4.28 4.22 4.16 4.11 4.05
69.5 4.54 4.48 4.42 4.36 4.30 4.25 4.19 4.13
70 4.62 4.56 4.50 4.45 4.39 4.33 4.27 4.21
70.5 4.70 4.64 4.59 4.53 4.47 4.41 4.35 4.30
71 4.78 4.73 4.67 4.61 4.55 4.49 4.44 4.38
71.5 4.87 4.81 4.75 4.69 4.63 4.58 4.52 4.46
72 4.95 4.89 4.83 4.78 4.72 4.66 4.60 4.54
72.5 5.03 4.97 4.92 4.86 4.80 4.74 4.68 4.63
73 5.11 5.06 5.00 4.94 4.88 4.82 4.77 4.71
73.5 5.20 5.14 5.08 5.02 4.96 4.91 4.85 4.79
74 5.28 5.22 5.16 5.11 5.05 4.99 4.93 4.87
74.5 5.36 5.30 5.25 5.19 5.13 5.07 5.01 4.96
75 5.44 5.39 5.33 5.27 5.21 5.15 5.10 5.04
75.5 5.53 5.47 5.41 5.35 5.30 5.24 5.18 5.12
76 5.61 5.55 5.49 5.44 5.38 5.32 5.26 5.20
76.5 5.69 5.63 5.58 5.52 5.46 5.40 5.34 5.29
77 5.77 5.72 5.66 5.60 5.54 5.48 5.43 5.37
77.5 5.86 5.80 5.74 5.68 5.63 5.57 5.51 5.45
78 5.94 5.88 5.82 5.77 5.71 5.65 5.59 5.53
78.5 6.02 5.96 5.91 5.85 5.79 5.73 5.67 5.62
79 6.10 6.05 5.99 5.93 5.87 5.81 5.76 5.70
79.5 6.19 6.13 6.07 6.01 5.96 5.90 5.84 5.78
80 6.27 6.21 6.15 6.10 6.04 5.98 5.92 5.86
80.5 6.35 6.29 6.24 6.18 6.12 6.06 6.00 5.95
81 6.44 6.38 6.32 6.26 6.20 6.15 6.09 6.03
81.5 6.52 6.46 6.40 6.34 6.29 6.23 6.17 6.11
82 6.60 6.54 6.48 6.43 6.37 6.31 6.25 6.19
82.5 6.68 6.62 6.57 6.51 6.45 6.39 6.33 6.28
83 6.77 6.71 6.65 6.59 6.53 6.48 6.42 6.36
83.5 6.85 6.79 6.73 6.67 6.62 6.56 6.50 6.44
84 6.93 6.87 6.81 6.76 6.70 6.64 6.58 6.52
84.5 7.01 6.95 6.90 6.84 6.78 6.72 6.66 6.61
85 7.10 7.04 6.98 6.92 6.86 6.81 6.75 6.69
Helper 1.3

Try to look to the Pulmonary Diseases' table (a link is available after problem 1.3 assignment).

What kind of a disease is signalized by a reduced Forced Vital Capacity?

Helper 1.4

Try to go back to the text before the problem 1.4, read it carefully again and pay attention to the graph.

What exactly are describing concepts Tidal Volume, Expiratory Reserve Volume, Inspiratory Reserve Volume?

Which parts of our patient's Spirometry curve represent these volumes?

Spirometry curve
Helper 1.5

Try to go back to the text before the problem 1.4 and read it carefully once again.

What Vital capacity should have a healthy man who is 56 years old and 171 centimeters tall?

What percentage of a Vital Capacity should be reached in Tidal Volume for a healthy human?

What percentage of a Vital Capacity should be reached in Expiratory and Inspiratory Reserve Volume?

Helper 1.6

What Vital capacity should have a healthy man who is 56 years old and 171 centimeters tall?

What Tidal Volume, Expiratory Reserve Volume and Inspiratory Reserve Volume should he has?

Try to put these volumes to our patient's spirometry curve?

Forum

We are preparing a new forum for you!

If you have any questions or if you need any help, I will be glad to help you! Please feel free to send me an email (martina.babinska.sk@gmail.com).