

-
 MATHEMATICS AND THE WORLD AROUND USREAL-LIFE, REAL-WORLD, CONTEX-BASED, APPLIED MATHEMATICS
Spirometry Curve
I. Parameteres Signalizing Respiratory Problems
One of the main parameters, which indicates respiratory problems, is a (FORCED) VITAL CAPACITY (FVC).
FVC represents the volume of air maximally fiercely breathed out after the deep inhalation.
The healthy, non-smoker human's FVC is defined by TABLES.
If the patient's FVC is different from the table - predicted value, it can signalize a disease.
Why do we need this information?
Our first task is to FIND PATIENT'S FORCED VITAL CAPACITY and to COMPARE IT with a table (predicted) value. If there is nearly no difference between these two values, we can expect, that our patient does not have any breathing problems.

A piece of history
There were many famous doctors studying human Vital Capacity during the last centuries.
One of the first was Galen, well-known famous Greek doctor (2th century).
Later, Giovannin Alfonso Borelli (1679) rapidly increased the measurement accuracy, using the patient's nose blocking.
John Hutchinson (1849) created the first fully functional spirometer (water spirometer). Later, based on 4000 measurements, found a linear dependence between the vital capacity and a human height.
The first patient
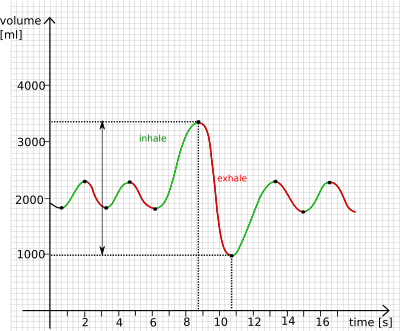
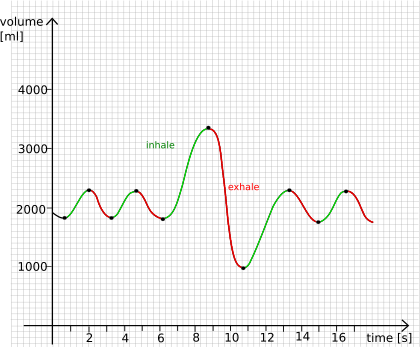
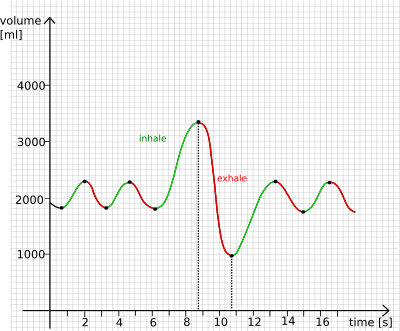
Our first patient is a MAN, 56 years old, 171 centimeters tall. The result of his spirometry assessment is in the right picture.
(The volume represented on a graph is an air volume, inhaled and exhaled into/out of the patient's lung.)
Problem 1.1:
What is the patient's Forced Vital Capacity?
Problem 1.2:
Is there a difference between our patient's measured forced vital capacity and a forced vital capacity of a healthy, 56 years old, 171 cm high man?
(Predicted FVC values are avilable HERE )

Do not you know how to solve the problems?
NO PROBLEM :)-
 01
01
Read again
Try to read the previous text again and find, the deffinition of the FORCED VITAL CAPACITY.
-
 02
02
Use a helper
If you still need a help, use a HELPER. It is denoted by the same number as your problem (right menu - bulb picture :))
-
 03
03
Controll your answer
It is every time a good idea to check your answer. You can use available answers (right menu - check mark picture :))
-
 04
04
Continue or help your friends
When you checked your answer, you can pass for the next problem.
OR You can also help your friends by checking the questions in a forum.
II. Respiratory System Diseases
Solution of the Problem 1.2 showed us, that our patien's FVC (FORCED VITAL CAPACITY) is decreased/reduced.
But, what does it mean? What kind of a disease can our patient have?
To answer this question we need to know, what kind of pulmonary diseases exist. The list of existed pulmonary diseases and their description is available HERE.
Problem 1.3:
What kind of a disease can be expected if patient's FORCED VITAL CAPACITY is decreased?
( Pulmonary diseases description is avilable HERE )
III. Comparison between Spirometry Curves
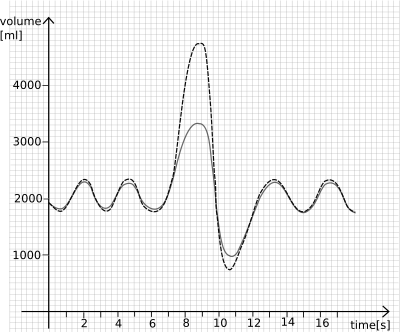
Solution of the Problem 1.2 showed us, that our patien's FVC (FORCED VITAL CAPACITY) is decreased/reduced. As you probably remember, to find this fact, we had to go to the table and find FVC value manually. That was quite time consuming and it could be very annoying if we have to repeat it many times. To help the doctor and save his time a real spirometry result already contains these table/ideal values of a healthy human. These values are usually adduced in the brackets or in the next column. There also can be a healthy human's spirometry curve graph marked by a dashed line included in a patient's measured spirometry curve graph.
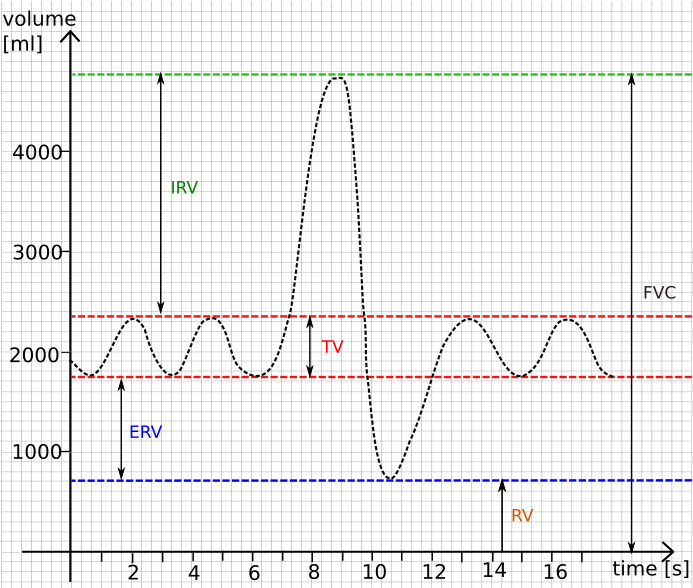
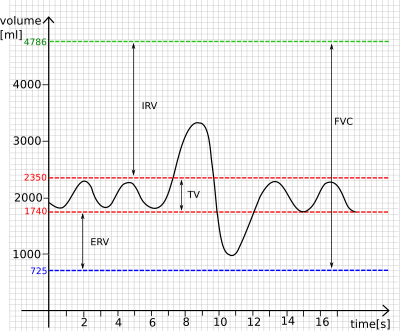
If we want to create this healthy human's spirometry curve, it is necessary to know a Forced Vital Capacity parameter. Hovewer, it is not enough. We also need to know parameters like Tidal Volume, Expiratory Reserve Volume, Inspiratory Reserve Volume and Residual Volume.
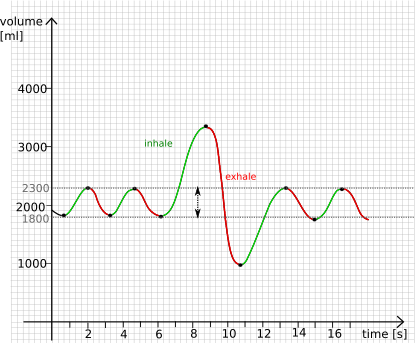
Tidal Volume (TD) - the volume of an air moved into or out of the lungs during quiet breathing (it is bordered by the red dashed-lines on the right graph).
The healthy adult's TV value should be 15 - 18 % of his Forced Vital Capacity.
Expiratory Reserve Volume (ERV) - the maximal volume of an air that can be exhaled from the end-expiratory position.
The healthy adult's ERV should be 25 % of his Forced Vital Capacity.
Inspiratory Reserve Volume (ERV) - the maximal volume of an air that can be inhaled from the end-inspiratory level.
The healthy adult's IRV should be 60 % of his Forced Vital Capacity.
Residual Volume (RV) - the volume of an air remaining in the lungs after a maximal exhalation.
It is not possible to measure this volume directlly and we are not working deeper with it now.
